Air
Pollution
There
are very few areas of Britain that are safe from air pollution. Government
health standards are exceeded many days throughout the year - in rural areas as
well as urban. It is estimated that air pollution causes several thousand
premature deaths every year. The health of 1 in 5 people is at risk from
air pollution in the U.K. The people who are vulnerable are young
children, pregnant women, the elderly, and people suffering from heart and lung
diseases.
The impact of air pollution
on health can also be assessed in monetary terms: the cost of health care, the
cost of days of work lost, the economic cost of premature deaths. The National
Asthma Campaign has estimated that asthma costs the UK over £1 billion per
year. Environmental economists have estimated the cost of air pollution from
road transport at £19.7 billion per year.
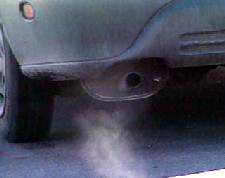
Road transport is a major
source of air pollution in the UK. In London, traffic is
responsible for 99% of carbon monoxide, 76% of nitrogen oxides and 90% of
hydrocarbons. The pie chart below shows the contribution made to
greenhouse gases by the transport sector was a fifth of the total amount
produced in the European Union in 2001 (European Environment Agency, 2002).
When
pollution levels are high, the contribution of road transport is often greater.
For example, analysis by government experts shows that when particulate levels
exceed health standards, then road traffic's contribution is in the range of
75-85% (more details about carbon monoxide, nitrogen
oxide, hydrocarbons and particulates are provided below). Summertime smog,
or ozone, is also caused by traffic. It does not come directly from
vehicles or factories but is created by chemical reactions between other
nitrogen oxides and hydrocarbons. How traffic produces air pollution and
steps
we can take to reduce it are outlined next.
Pollutants
and How They are Caused
 The
internal combustion engine has been developed into a powerful, reliable and
compact power unit. These engines work by burning fuel in cylinders and
expansion of this burning fuel pushes a piston down. The piston in turn
pushes a crankshaft around; much like a person's legs pushes the pedals around
the crank on a pushbike. The rotary motion of the crankshaft is then used
to power the transmission that allows the vehicle to be driven at different
speeds. The big disadvantage of these engines is the combination of
impurities in the fuel and the process of burning it produces pollutants.
The
internal combustion engine has been developed into a powerful, reliable and
compact power unit. These engines work by burning fuel in cylinders and
expansion of this burning fuel pushes a piston down. The piston in turn
pushes a crankshaft around; much like a person's legs pushes the pedals around
the crank on a pushbike. The rotary motion of the crankshaft is then used
to power the transmission that allows the vehicle to be driven at different
speeds. The big disadvantage of these engines is the combination of
impurities in the fuel and the process of burning it produces pollutants.
The Four
Stroke Internal Combustion Engine
The
pollutants that are produced by internal combustion engines are: nitrogen
dioxide, carbon monoxide, benzene, particulates and hydrocarbons. The
problems associated with these different pollutants are given below:
Nitrogen
dioxide: May aggravate asthma symptoms. Can
cause a tightening of the chest and reduced lung function. Can make airways more
sensitive to allergens such as house dust mite. By disrupting the body's natural
cleansing mechanisms nitrogen dioxide may increase the body's susceptibility to
viral infections.
Carbon
monoxide: Slows reflexes, impairs thinking and
causes drowsiness by reducing the oxygen-carrying capacity of the blood. Can
increase the likelihood of exercise- related pain in people with coronary heart
disease.
Benzene: A known carcinogen
(something that causes cancer) that can cause leukaemia.
Particulates:
Consistent correlation between particle levels and death rates. High levels of
particles have also been linked with increased hospital admissions and asthma
attacks. Smaller particles can carry carcinogenic particles into the lungs.
Hydrocarbons
(Ozone): Irritates the mucous membrane of the
respiratory system, causing coughing, choking and impaired lung function,
particularly in people who exercise. Other symptoms include headaches, eye nose
/ throat irritation and chest pain on deep breathing. Can make airways more
sensitive to allergens such as pollen. Can also impair defences against bacteria
and viruses.
Reducing
Pollution
A
new car meeting the latest toxic emissions standards is around 30 times cleaner
than a new car in the early 1980’s. There are three main reasons for this:
improvements in fuel, cars being more fuel-efficient and the use of catalytic
converters.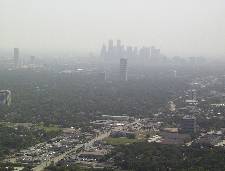
Petrol
used to have lead
added to it get a higher octane number and therefore more power. Lead emissions
have decreased by about 91.5% since the late 1980s. This is because the amount
of lead allowed in petrol was reduced in 1985 and was banned in 2000. In
more recent times, petrol companies have been decreasing the amount of sulphur
added to petrol.
Cars
are using less fuel than they used to. It is now common to have 5 speed
gearboxes (and some now have 6) whereas the norm used to be 4. Engines are
more efficient and cars are more aerodynamic. The rise in the use of
diesel cars has helped although these produce more particle emissions.
Fuel consumption per passenger kilometre fell by about 10 per cent during the
1980s, as distance travelled by passengers increased by more than fuel used by
passenger vehicles. Following increases in the early 1990s, there have been
further reductions, and by 2002 fuel consumed per passenger kilometre was 13%
per cent lower than it had been in 1980.
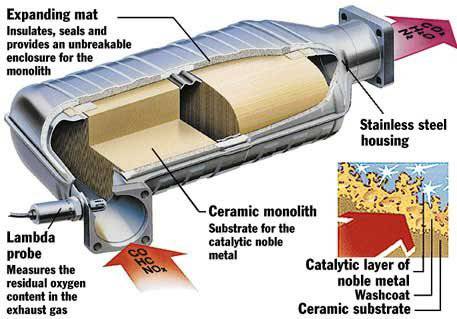
Although
road transport users remain the main producers of carbon monoxide, there has
been a substantial reduction in emissions since 1990. Levels have fallen sharply
since 1990, from 5.5 to 2.3 million tonnes, despite increased traffic. This is
primarily due to the introduction of catalytic converters on petrol cars that
help reduce toxic emissions (see diagram below).
Catalytic
Converter
Even though average carbon
dioxide emissions from new cars have reduced over recent years, increases in car
ownership and mileage mean that total carbon emissions from road transport
haven't decreased for the last decade. The government has set some targets
for carbon emissions and at the moment progress has not been swift enough to
meet the targets. For example, the target for a 25% reduction in carbon
dioxide emissions for 2008 set in 1998 is behind schedule (a reduction of 9% had
been achieved by 2003). One
promising way of reducing emissions is to change the way we power our cars.
Hybrid and hydrogen powered cars have a great deal of promise - for more info
click here.
There
are several other measures that can be used to help reduce the amount of road
traffic pollution. These include urban traffic management, junction
control, parking restrictions or traffic calming. The table below (TRL,
Report 174) outlines some possible advantages and disadvantages of these
measures. On faster roads, such as busy motorways, reducing the speed
limit during heavy traffic can help keep the traffic moving and therefore reduce
pollution. For more about controlled motorways read about the M25's variable
speed limits.
Traffic
Management Schemes
|
Traffic management measure |
Outer city/local |
Inner city/central area |
Citywide |
|
Urban Traffic Control system for
central area |
- |
Fuel consumption reduced 5% to 15% |
Not known |
|
Traffic signal optimisation at
isolated traffic signals |
Reduced fuel consumption of up to 25% |
Not applicable |
Not known |
|
Different junction control |
Emission changes of between 5% and
20% |
- |
Very small changes |
|
Public transport priority |
Bus emissions reduced by up to 60% |
Little impact on model split without
car restraint |
Uncertain, but probably small changes |
|
Park and ride |
May increase car trips |
Little impact on car use without
restraint |
Uncertain |
|
Halving parking places in central
area |
Increased car model split from 61% to
67% |
Reduced car model split from 56% to
29% |
Reduction in CO2
equivalent emissions between 4% to 6% |
|
Central area traffic ban |
Increases in traffic outside banned
area |
Reduction of emissions in proportion
to vehicles banned |
Probably quite small e.g. 5%
reduction |
|
Parking control on major urban roads |
Reduction in vehicle emissions of 1
to 16% on routes affected |
Reduced congestion may attract more
vehicles |
Not
known |
|
Traffic
calming |
Probably
reduced NOx but may increase HC, CO and fuel consumption |
- |
Uncertain
but probably small |
|
Lower
speed limits (depends on enforcement) |
Lower
exhaust emissions |
Lower
exhaust emissions |
Small
changes e.g. up to 2% reduction in NOx |